Jira offers a wide range of possibilities for businesses to create dashboards tailored to their needs. They provide easy visibility over ongoing activities and enable teams to monitor progress efficiently. From accounting to support, projects to invoices, Jira dashboards can cater to various use cases.
In this blog post, we’ll explore the essential components of an effective Jira dashboard. But before we dive into that, let’s talk about why easy-to-digest information is vital for any dashboard.
Easy to digest information is key
The success of any dashboard lies in its ability to present complex data in a user-friendly manner. Any user should be able to quickly grasp the status of various tasks without feeling overwhelmed by excessive information or unreadable data.
That’s the first step. To take things further the dashboard should become our single point of entry. Additionally to providing an overview over everything that’s happening, users can get a list of their tasks and access all the data they need.
A well-structured dashboard should be clutter-free and have gadgets that are easy to read and interpret. Whether you’re a project manager or a team leader, accessing important information in one place can significantly improve decision-making as well as productivity.
How to start building your dashboard
Let’s take a look at the fundamental elements that can make any dashboard effective. For this blog post, we will focus on the example of a support team leader who deals with multiple tickets and customer queries.
We start off with a basic overview of the support team’s tickets. For this we can use the simple ‘Filter Results’ gadget by Atlassian. Just create a filter including all support tickets and add it to the gadget.
Additionally, it can help to have a separate list of their own tasks and tickets as well to ensure nothing falls through the cracks.
To get more insights into the team’s progress you can add key metrics like ‘Created vs. Resolved’ tickets or ‘Resolution Time’. These help track the team’s productivity and identify potential bottlenecks in time. Both metrics are part of Atlassian’s set of gadgets.
Now the leader has an overview over their own and their team’s tasks. Which is a great start but if you do support for customers too, you need to have an overview over the time spent per customer as well.
Meaning, in a support-centric dashboard, it’s crucial to have insights into each customer’s ticket status. Displaying which tickets are open, in progress, or resolved per customer allows the team leader to identify high-priority cases and allocate resources accordingly. To do this you can use the ‘Two Dimensional Filter Statistics’ gadget which is also provided by Atlassian. The configuration is as follows:
XAxis=Jira Project (Each customer has its own)
YAxis=Status
If you have a lot of support contingents, integrating tools like Epic Sum Up can help you get an easy overview over how much time is already spent and how much is left. Just by looking at the progress bars in the provided dashboard gadget.
Extend your dashboard with search power
Now, all these task lists and reports are great to get an overview over what’s going on. But what if you need more details on something? You can’t put every single detail on the dashboard. But what you can do is add a gadget that lets you search for those missing things.
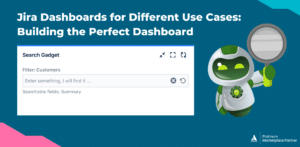
Our Context Search Gadget for Jira helps you quickly search for specific things in different contexts. While in JQL you use queries including full text search, with the search gadget you define your JQL/filter once and then easily use full text search.
Let’s look at the example of customers. The support team leader wants to see how many tickets have been raised by a specific customer. If their Jira customers are an issue type and every customer has one issue with their tickets underneath. In order to find the specific customer issue they’re looking for they could leave the dashboard and use Jira search. Since it’s easier to stay on the dashboard, they could use the search gadget instead.
The configuration takes only three minutes and can be done once, when you add the gadget to the dashboard. Let’s go over the configuration together.
First, you narrow down the search context by using a predefined filter or JQL. In our case this filter would be ‘issuetype=customer’. Then you define the fields that will be searched. In this example we will just use the summary. After that you can select which fields the search result will display. These can be the same as the fields to be searched but you can also add additional options. In this case we will select the fields: ‘Summary’, ‘Key’ and a custom field called ‘Total number of tickets’. After that we can copy this field to the fields that will be displayed and add some more like key and for this example a custom field called ‘Total number of tickets’. Save and start typing in the customer’s name that you are searching for, into the search field. You will have the result in 2 seconds.
You can use the Context Search Gadget for many other use cases like invoices, support contracts, internal projects and more. It allows you to easily dive deeper into individual cases, ensuring that nothing is left unnoticed. And with a link to the issues on the left of the search result list you can easily look deeper at different issues and their child issues.
Conclusion
A well-designed Jira dashboard can be a game-changer for team leaders and their teams across various use cases, providing them with easy access to critical information. The key lies in presenting data in a way that is easy to digest and relevant to the team’s specific needs.
To build the perfect dashboard for your team, experiment with different gadgets, layouts, and data visualization options. The Context Search Gadget can help you to easily find specific information without having to leave the dashboard.
So, are you ready to create a Jira dashboard that empowers your team and improves efficiency?
It’s a FREE app.


